


ADJUSTED TO INFLATION
This thread shows the comparison of wages to houses, cars, tuition, etc. throughout the last 200 years. The common worker today is living in the worst financial situation in history.


When people think about the Great Depression, many assume this was the worst moment to live in financially. This is far from the truth and this thread will prove that. By comparing the wages of Americans the last 250 years during specific years we will see the truth of how the common worker in 2024 is currently being stretched financially beyond imagination.
1813
The first year that we will look is the year 1813, which was the year the Napoleonic Wars happened and the Rothschilds rose to power financially in Europe. We will compare wages to the price of a House when everything was paid with hard money, rather than paper money.
A carpenter in 1813 was making $1 - $1.43 per day.
Carpenters on average make $75 - $125 per day in 2024 AD.
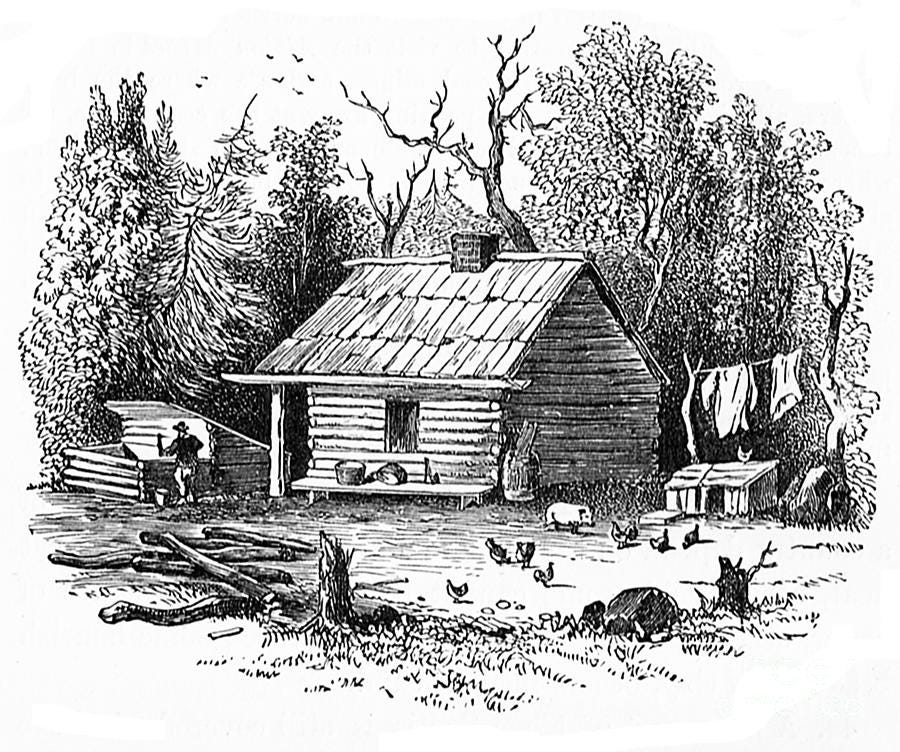
Using hired laborers, a two-room log house in 1813 might cost $100 to build; a smaller house might cost $50 - Source: Talbot's History of North America, vol. 2, p. 18.
Keep in mind the houses were a lot smaller but lets compare.
As of August 9, 2024, the median price of an existing single-family home in the United States was $432,700. That’s 5000 times the cost of houses back in 1813.
If we adjust for inflation, the carpenter making $75 - $125 per day in 2024 would only have to pay $3,750 - $8,741 for a house in 1813.
It would only take someone half a year to save up enough money to build a log cabin, which means if we compare the house prices of today, the carpenters wage would have to be $865,400 / year.
This was the most affordable time in United States history.
1861
The next year we will look at is when the American Civil War happened in 1861. We will once again compare wages with the price of a house but also the cost of owning and traveling in a horse carriage.
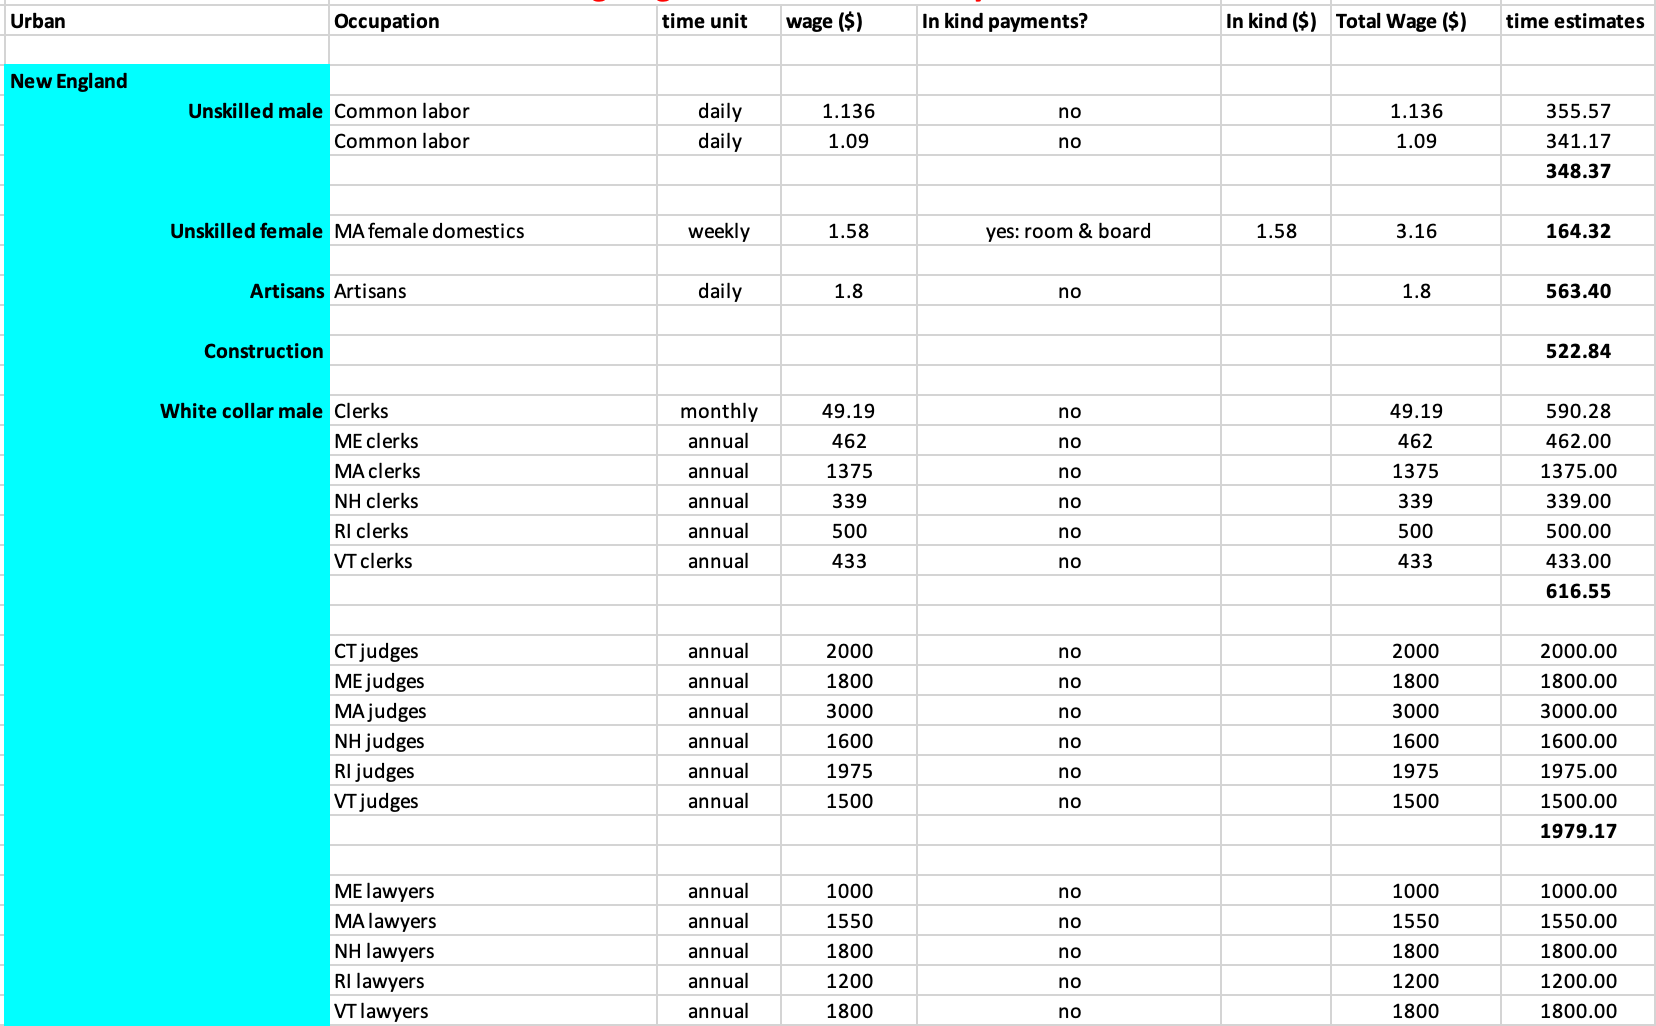
Just like in 1813 the average daily wage was around $1 a day for a common worker but a high end lawyer was making around $5 a day, which was around $1800 per year - Source
In the west US it was possible to buy a horse for as little as $10, but a decent riding equine cost around $150, with a range of $120 (1861) to $185 (1865). A pack horse for the Oregon Trail cost $25 in the US in 1850, but a riding horse would run you $75.
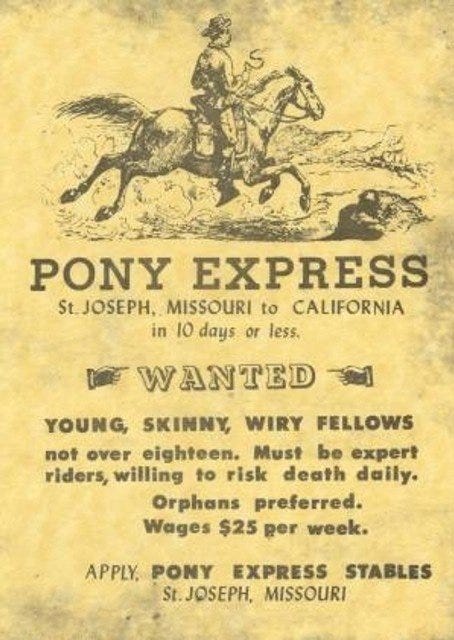
Lets compare. A horse was the main source of individual travel before the automobile came out but lets still see if the financial burden was as bad as buying a car today.
The average transaction price (ATP) for a new car in 2024 in the U.S. was $48,644, according to Cox Automotive.
Going forward we will compare every wage in the past to the minimum wage in 2024. The lowest minimum wage is $7.25 / hour, which equals $58 / day, which is shared by many states. The highest minimum wage is $16 / hour, which equals $128 / day, which is the min. wage of California.
So now lets enforce the 1861 economy into todays prices:
The common laborer when buying a new vehicle (horse) would only have to pay $580, since a cheap horse was only 10x the amount of his daily work. Today a car is 840x the amount of workers daily work.
The reason I used the cheap $10 horse in this example is because a car that costs $48,644 today is on the lower end of car prices.

The housing situation in the 1860’s was getting more expensive than that in the 1810’s, which is a pattern we will continue to see as we get closer to the present day.
Remember that as of August 9, 2024, the median price of an existing single-family home in the United States was $432,700. That’s still 1000 times the cost of houses back in 1813. But that’s because of inflation so lets compare the wage to housing prices to get a better idea:
Today, it is literally impossible for a minimum wage worker to afford a house. Making only $58 / day it would take them over 30 years just to collect the funds to buy a house. This is of course if this worker didn’t miss one of the 270 work days in a year and never took a vacation.
Back in 1860 on the $1 / day wage, it would only take someone 1.5 years to afford a $400 house. Life was affordable for even the lowest paying worker in the past.
Here’s a better way to look at it. In order for someone to pay for a $432,700 house in 1.5 years, like in 1860, the minimum wage can’t be lower than $288,466 / year. Think about that. That’s how much money the government, bankers, loaners, evil men, etc. have stolen from the common worker the last 200 years.
1908
50 years later the world went through the Industrial Revolution and saw the introduction of the automobile. In the year 1908, Henry Ford created the affordable Model T and it was the time period before the Federal Reserve was created, which established Central Banking.

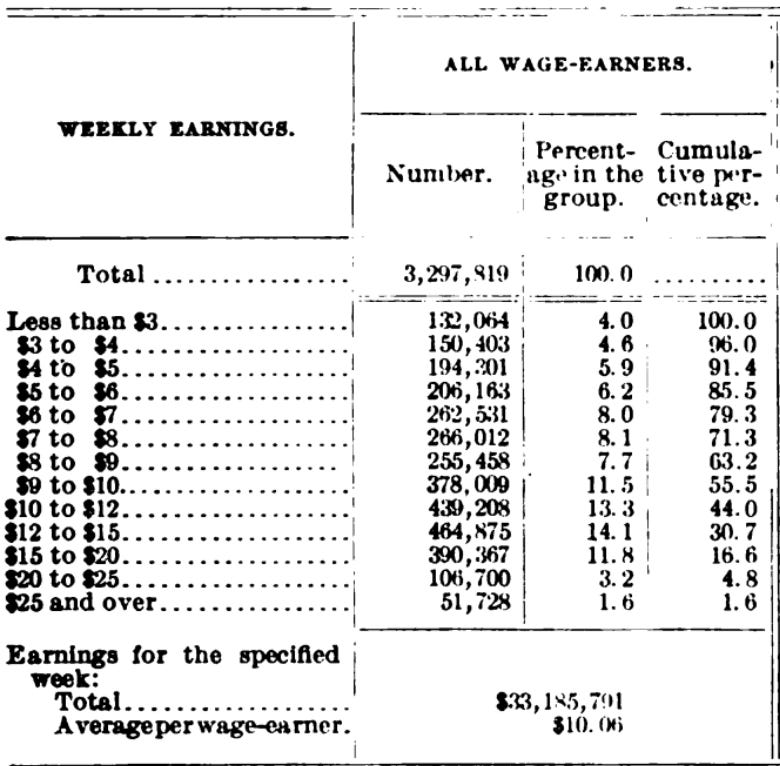
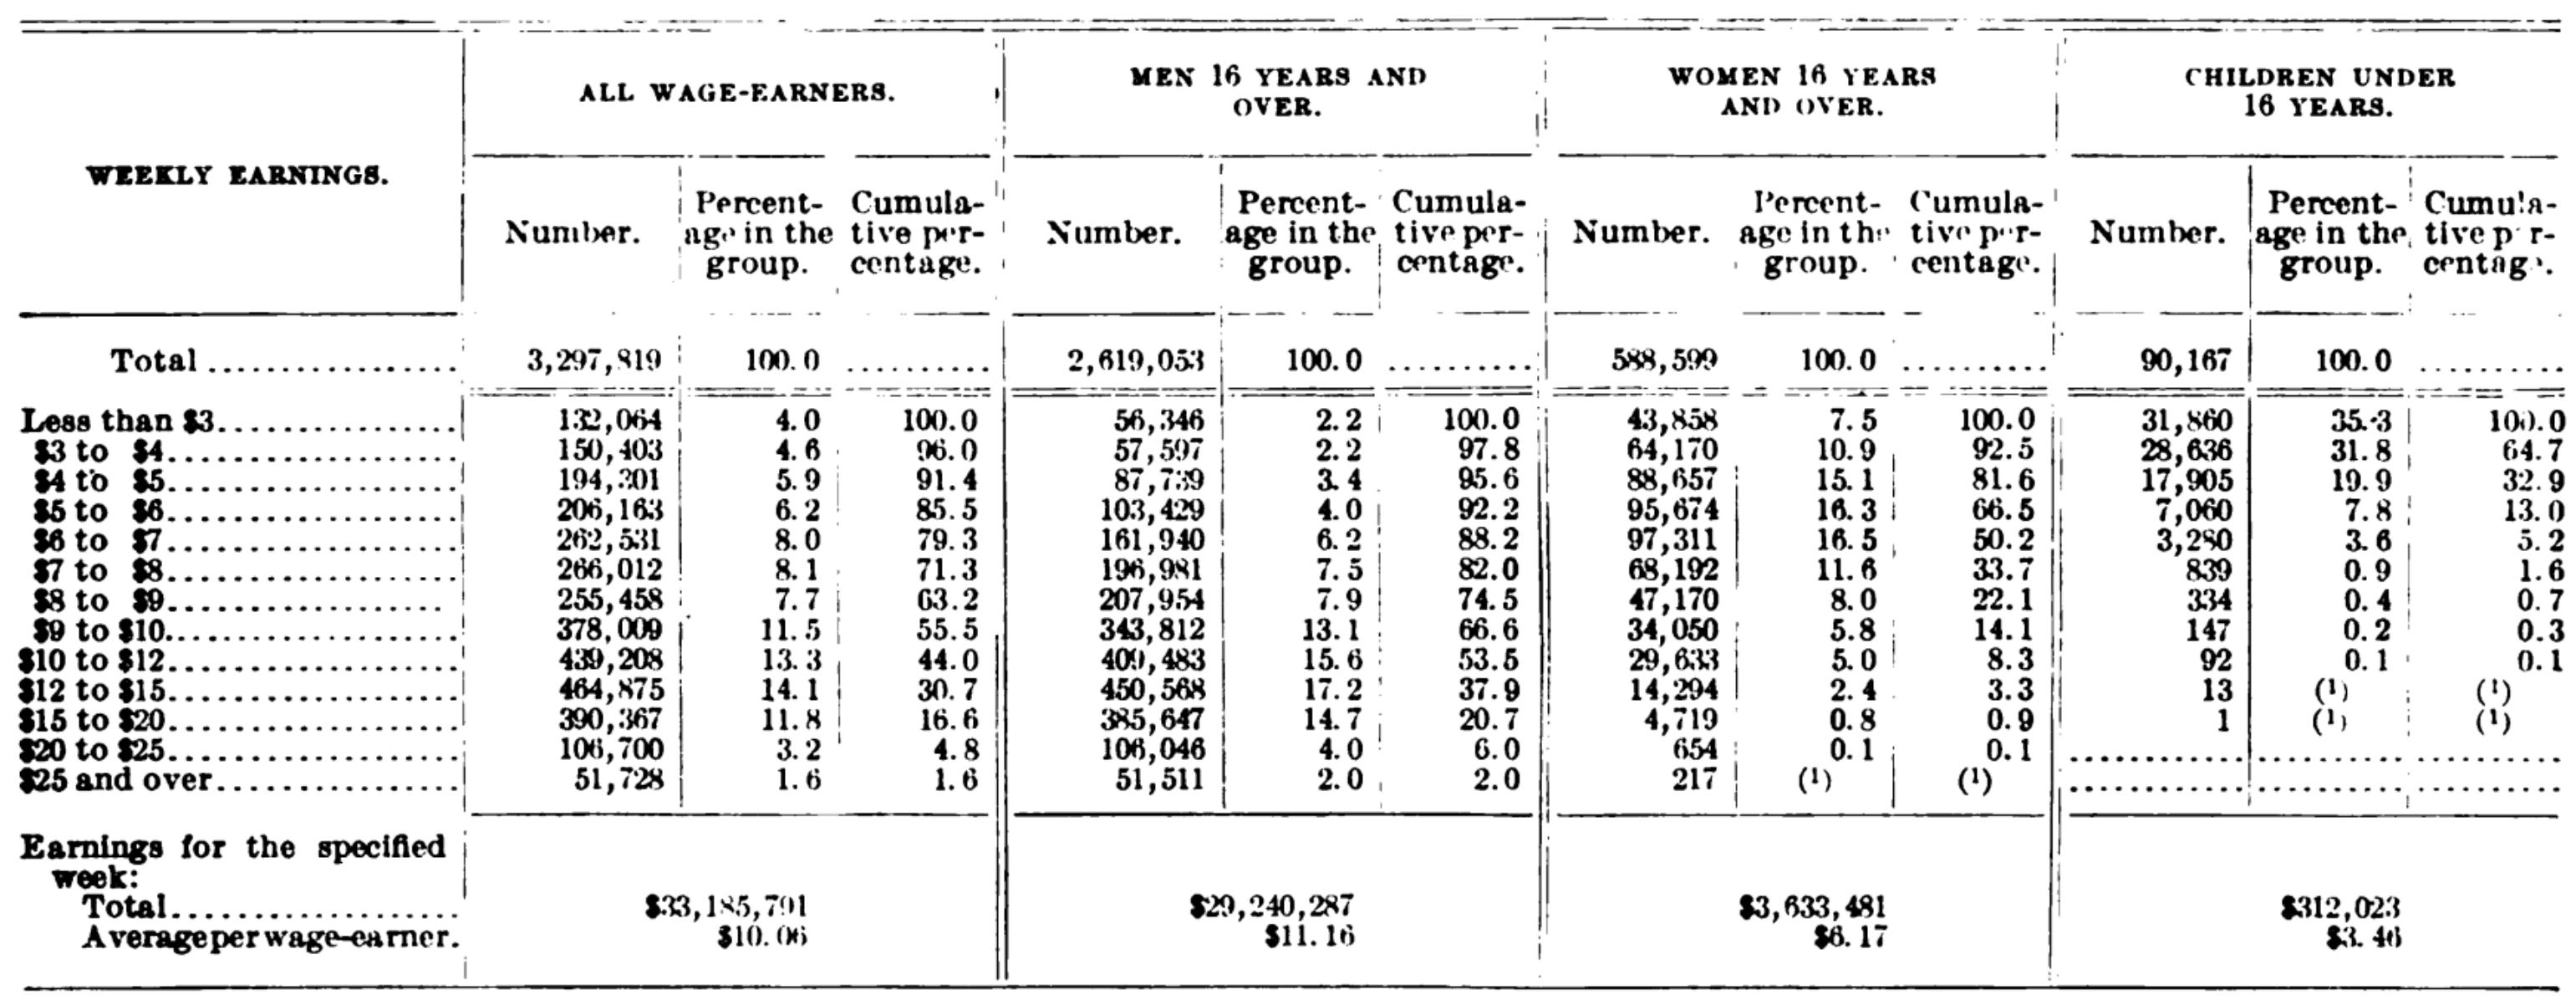
In this chart we see that some people are making less than $1 / day, which was the low in 1813 and 1861. Will the influx of immigrants rushing to American Big cities on the East coast, many immigrants were taken advantage of and played significantly less.
Because of the population boom in America rent becomes a major way for people to find housing.
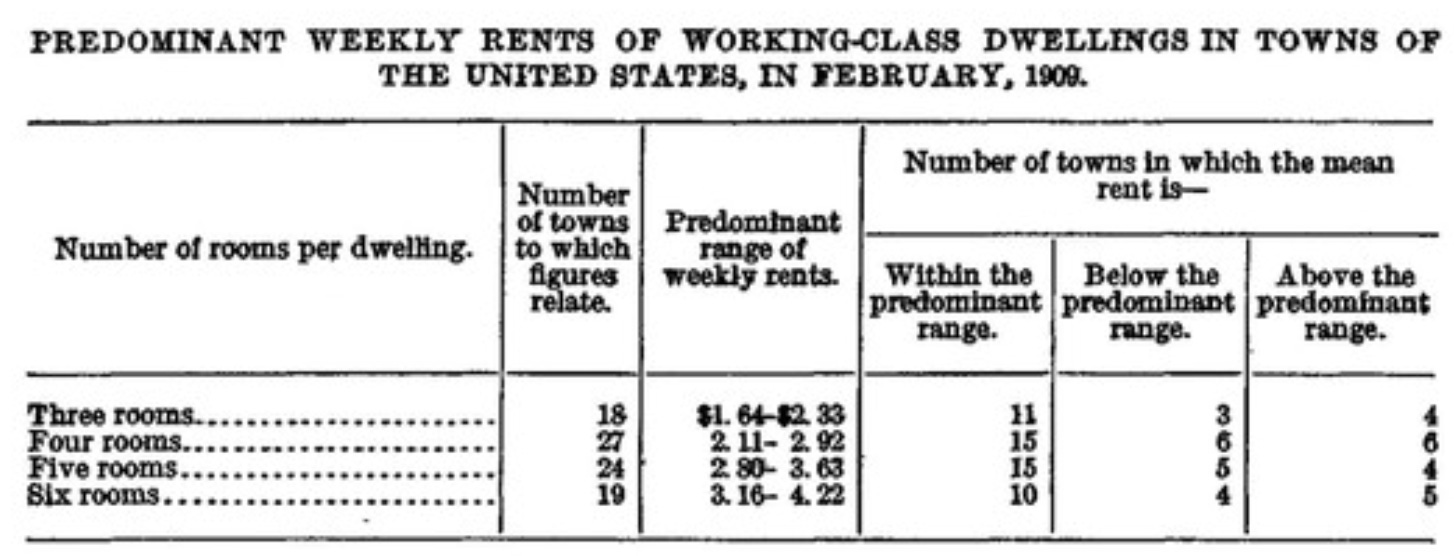
We also see the housing market forming, which saw the introduction of larger houses being mass produced. Here’s a great source of a 1903 booklet showing ‘The Radford American Homes’ and their prices.
Remember the evolution of home prices:
1813 —> $50 log house
1861 —> $400 - $1200 cottages
1908 —> $300 - $4200
Here’s a 1903 larger house selling for $3850:

Here’s a 1903 smaller house selling for $650:

Now lets compare:
The interesting thing is that gap between the poor man and commodities has increased. Many people in 1908 were being payed less than $3 a week. So lets see how long it would take them to afford a cheap house of $300. Since it’s easy math, it would take 100 weeks (2 years) for a low paying wage to afford a cheap house.
This is significantly better than the situation in 2024. The cheapest houses today sell for around $200,000. Remember the minimum wage worker makes $58 / day, which translates into $290 / week.
This means it would take them 13 years to afford the cheapest house, which is significantly worse than the poorest of the poor immigrants who moved to American in the early 1900s.
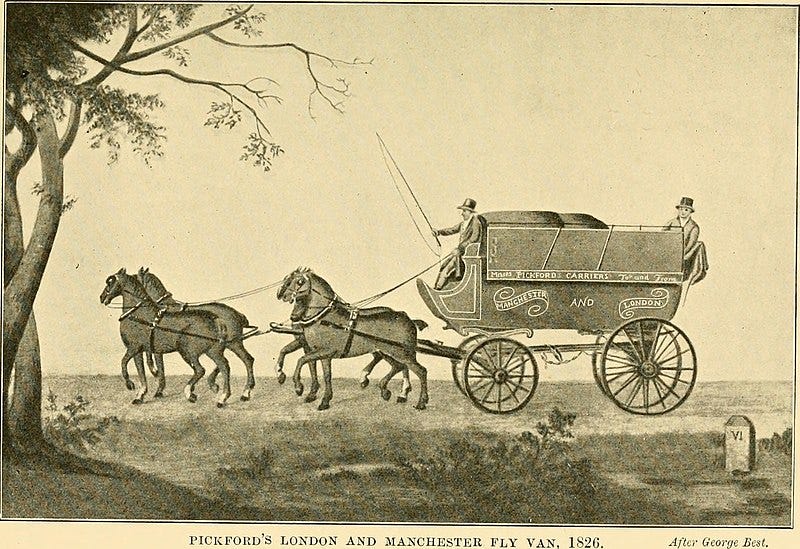
1908 was also the year the Ford Model T came out and when automobiles became the favorite transportation tool for the wealthy. As you will see these new automobiles cost as much as new houses.

Some vehicles were more expensive than new house when they came out. Very similar to today with the ultra wealthy cars, such as Rolls Royce, Lamborghini, etc.

The main source of transportation was still horse and buggy and the popularity of it wouldn’t decline until 1910 and would completely disappear in cities around 1920.
Since the wage of lowest paying worker declined and housing prices rose the standard of living decreased since the 1800’s but it was still significantly better than today. It took a low paying worker 2 years of saving in 1908 to afford a house, which translates to the minimum wage being $216,350 / year in today’s money terms.
1932
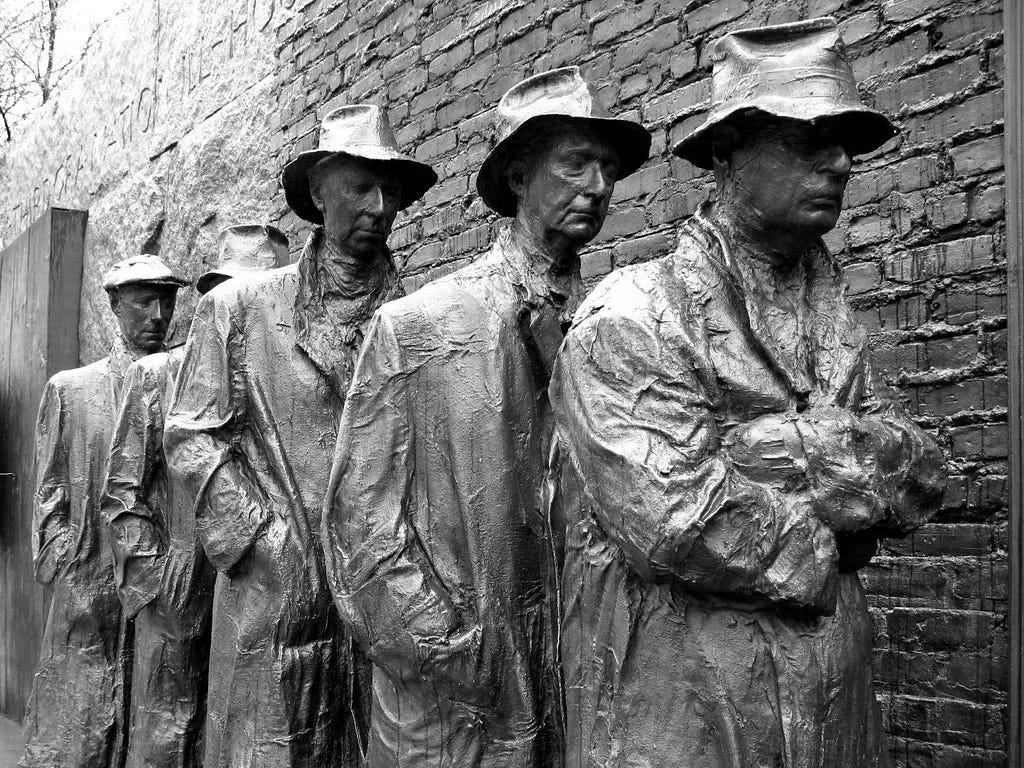
Now lets fast forward to the worst year of the Great Depression and see if it was worst than 2024.
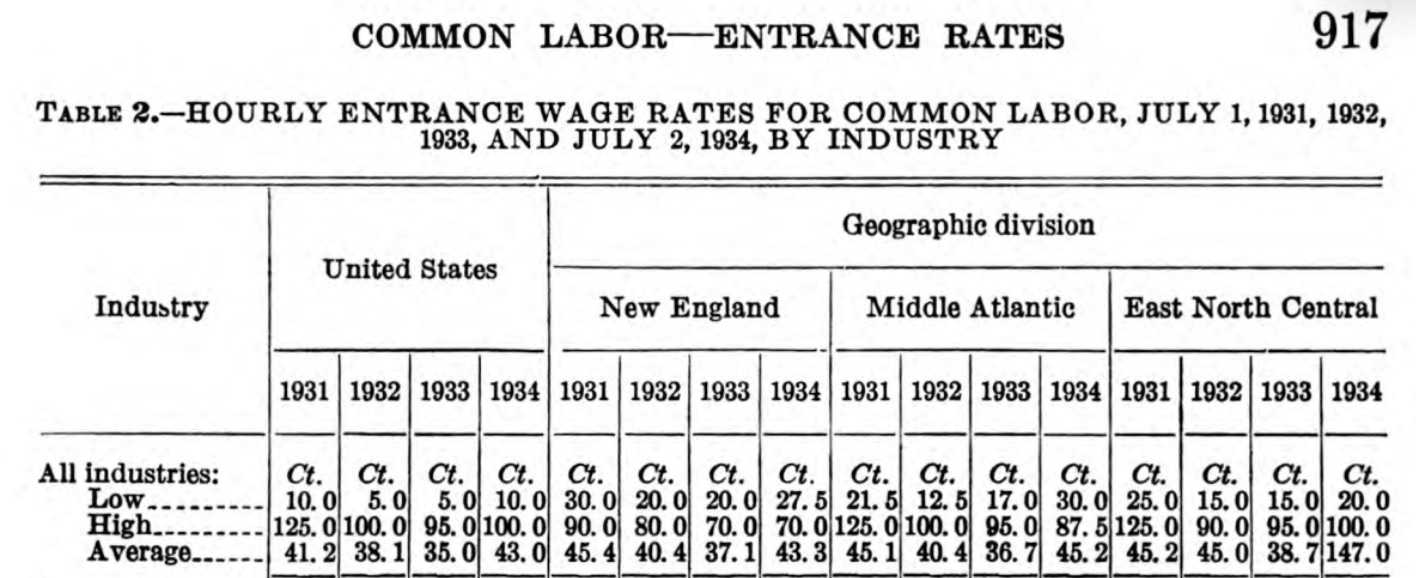
As you can tell this was they started tracking pay / hour. What’s interesting about the chart above is that the low paying workers made 5 - 10 cents per hour, which was even worse than the lowest payed workers in 1813.
The low payed workers were unfortunately the African Americans who were still being segregated during this time.
This major pattern of keeping the wages the same and increasing the prices of everything else shows that the government / companies don’t care about the workforce’s standard of living.
The world is run on greed and it continues to get worse every year.
The price of cars became more common for the everyday man and saw prices between $500 - $700. But with the wages of the poorest Americans decreasing since 1813, it would now take someone 4.5 years of saving to afford an automobile.

The days of buying an expensive horse for $75 were over. The days of caring about the standard living of the poor man were over. America was now down the road of making the rich richer and poor poorer.
The 1930’s is the first time we will see tuition prices for colleges - source:

The average tuition cost for a coeducational in state intuition was $76 / year. On a salary of $0.40 / day, it would take 266 days, which is less than a year.
Lets compare that with the average tuition price today with the minimum wage. The average tuition price in 2024 is $11,260 / year and the minimum wage in a lot of states is $58 / day. This mean it would take a person 270 days with that wage to afford college.
So in other words for a someone trying to pay for college and making the minimum wage in 2024, feels very similar to a segregated African American in the worst year of the Great Depression trying to afford to go to college.
But that’s just college so lets compare the prices of houses:
In the catalog below we see a Sears catalog of housing prices ranging from $1300 -$5000. Remember the lowest payed worker gets payed 0.40 - 0.80 cents per day so this would take the person making 40 cents per day 13 years to afford their home. This is still significantly better than the 2024 minimum wage worker taking 30 years to pay for a house.

This means the lowest payed worker during the worst year of the Great Depression was living in the same standard of living as someone making minimum wage in 2024.
So what happened between 1908 and 1931 that made the situation so much worse? It was the establishment of the Federal Reserve, the World War, the Great Depression, the introduction of income tax and the banks collecting gold from the citizens to force a paper economy they could control.
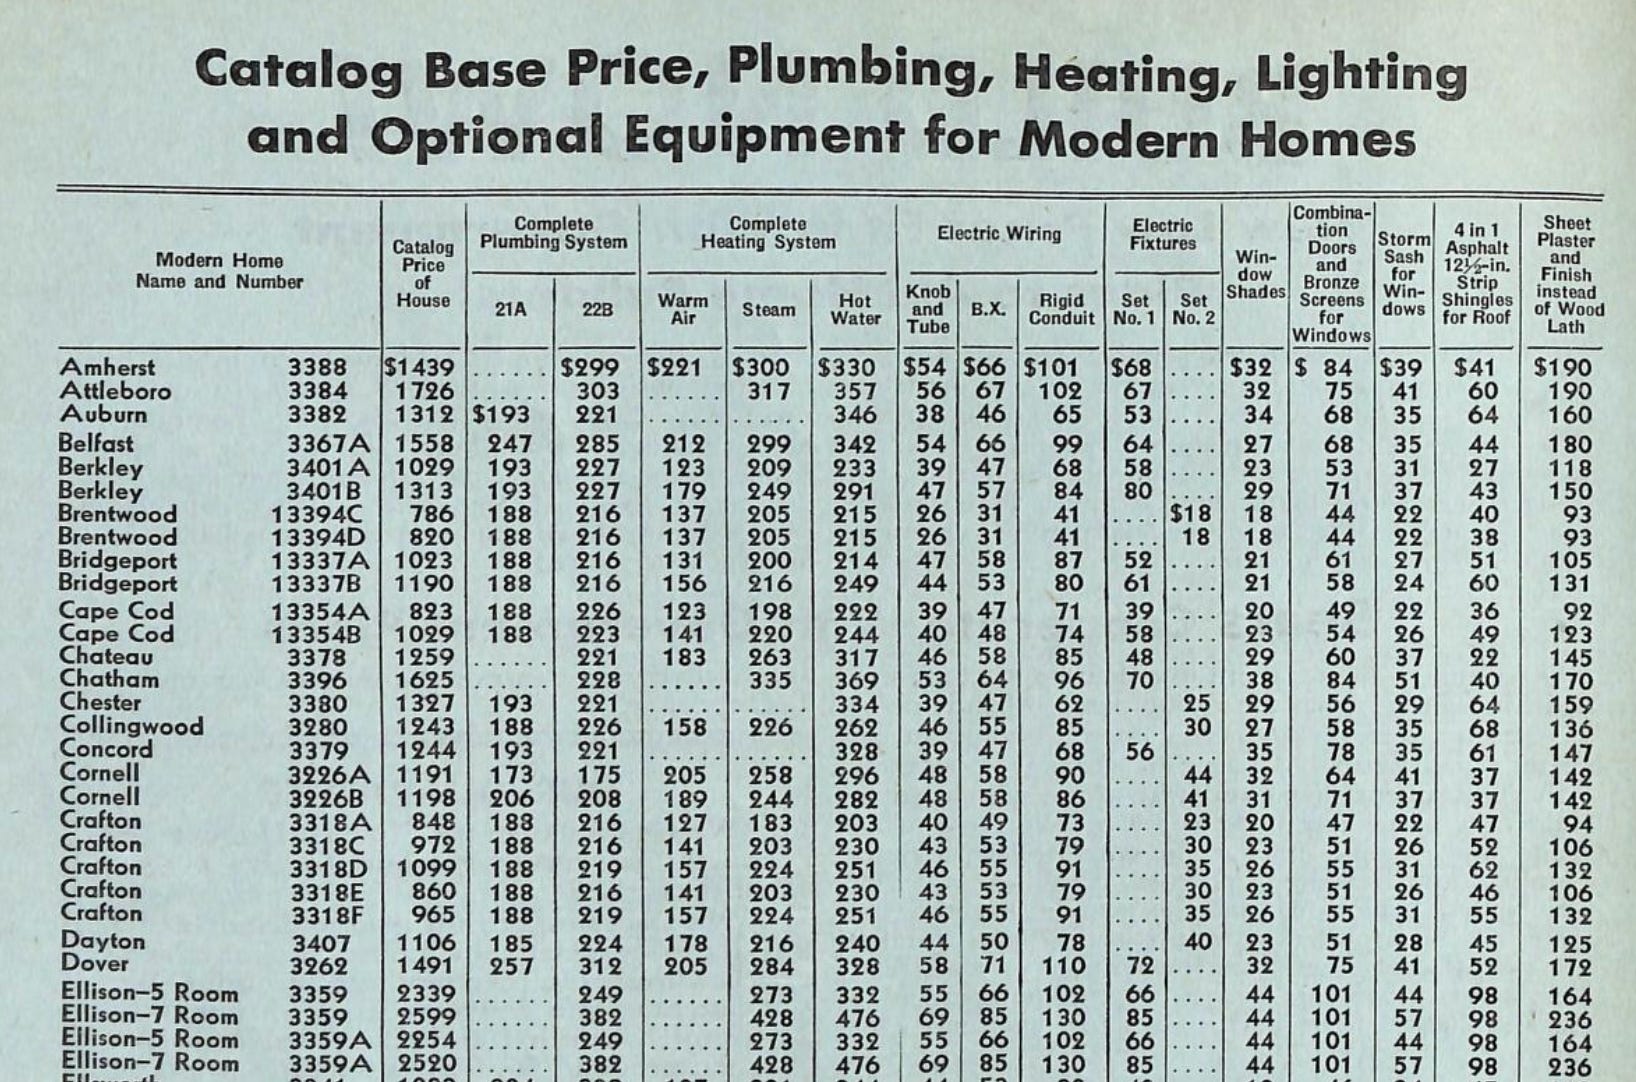
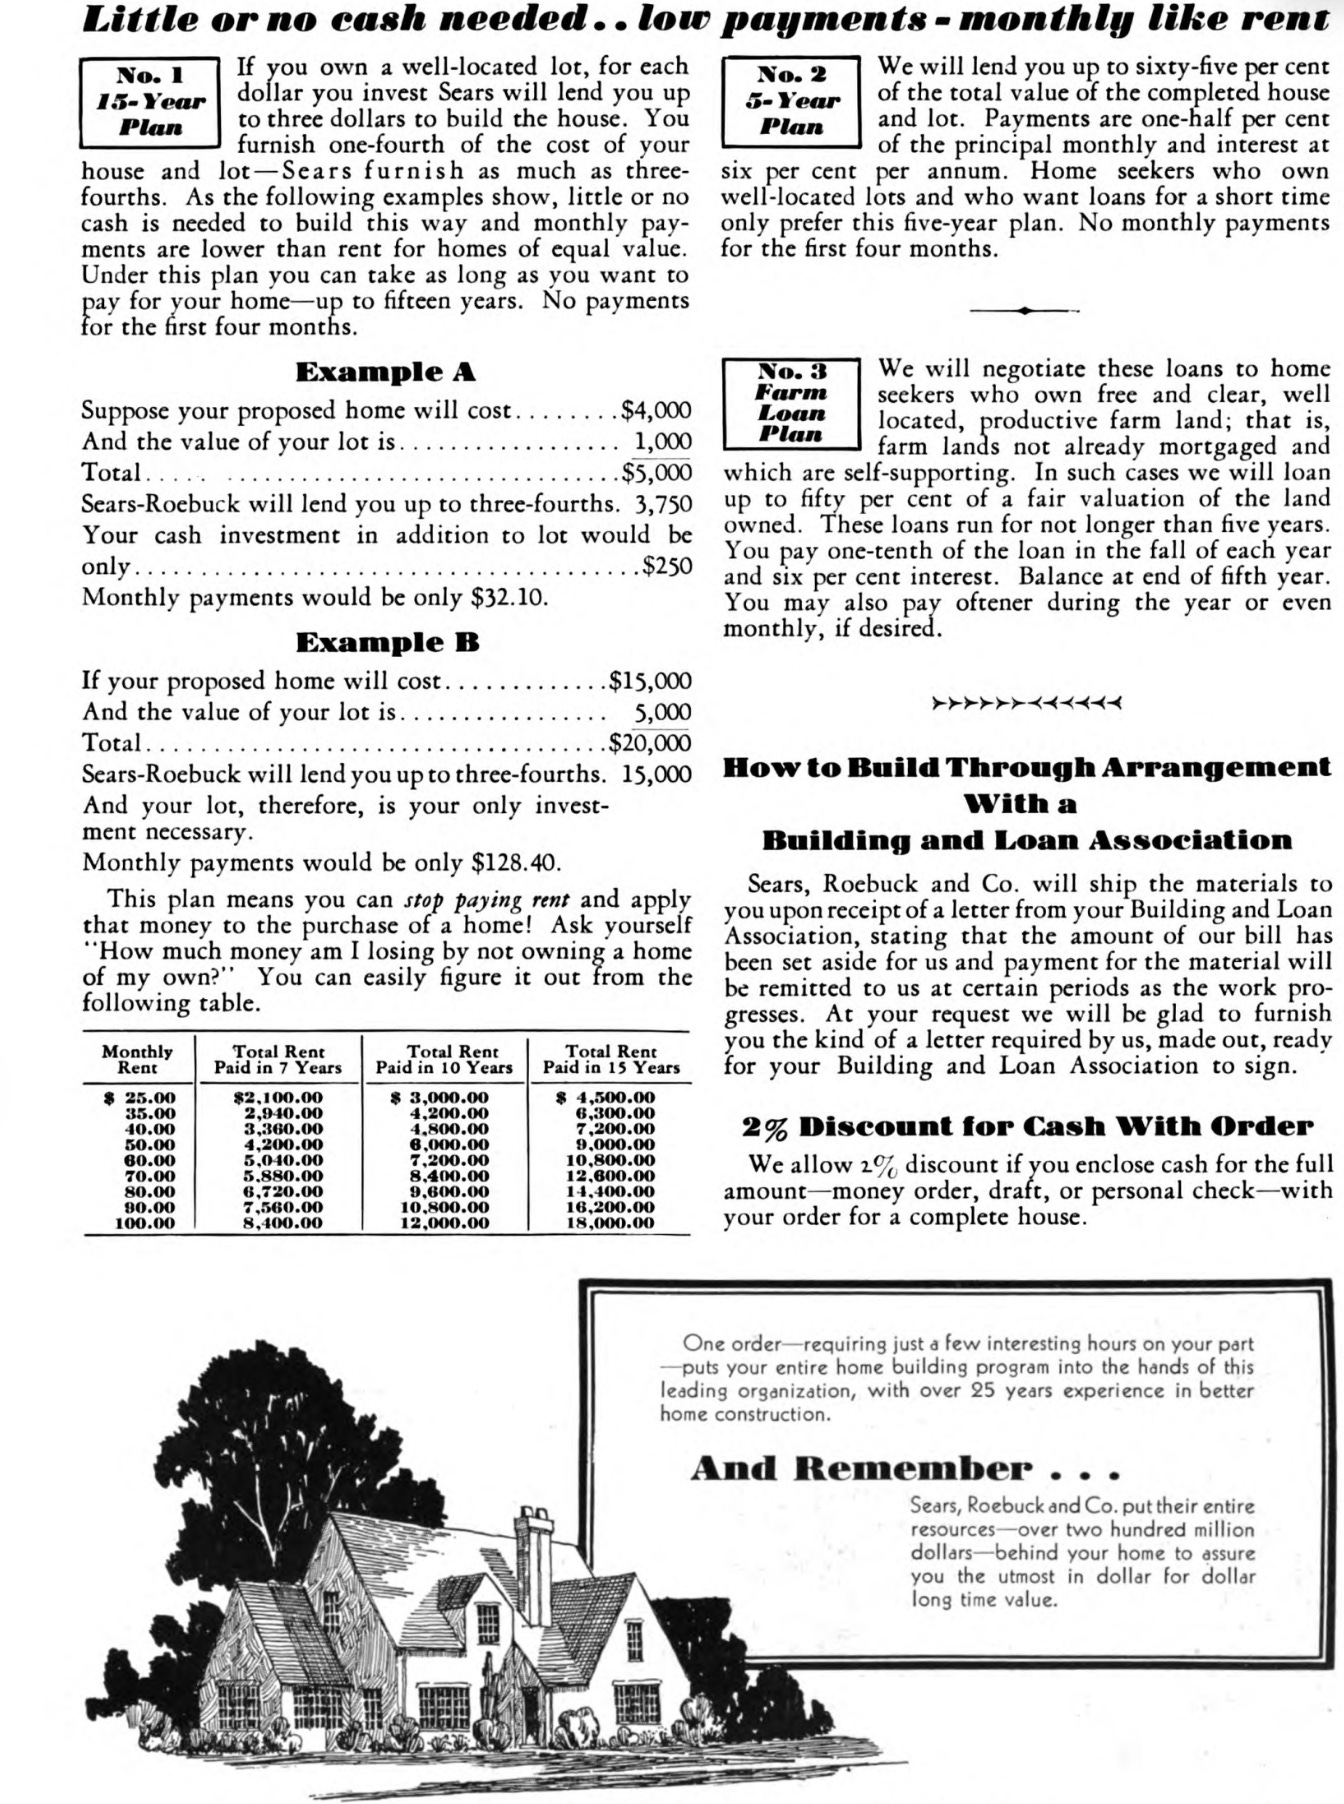
Also we see the introduction of Mortgage payments in the Sears catalogs that shows how much more money people are paying when using a loan. With the idea of ‘monthly like rent’ to push people to pay more for a longer period.
A segregated African American during the worst year of the Great Depression, when adjusted to inflation in 2024 was making $7.69 / hour, which is still better than the current $7.25 / hour minimum wage in 2024.
The conditions were so bad in the 1930’s that the United enacted the 1938 Act, which put the minimum wage at $0.25 / hour. This quintupled the lowest wage workers from 5 cents to 25 cents / hour.
This put the segregated African American at a comfortable $38 / hour, when adjusted to inflation in 1938.
In my opinion the United States needs to do this again because we are in the same predicament at the Great Depression with the wages being way too low.
1964
The 1960’s is known as some of the most economically prosperous times in the United States so lets see what life was like during this time period.
The minimum wage was now $1.15 / hour due to the 1961 amendment, which is significantly better than $0.40 in the 1930’s - Source
In 1965, a new Corvette cost $4,106, which allows us to make a perfect comparison. Lets take the minimum wages of 1964 and 2024 and compare it with the prices of a new corvette for the same years.

Minimum Wage:
1964 - $1.15 / hour
2024 - $7.25 / hour
New Corvette Price:
1965 - $4,106
2024 - $70,000
For someone making minimum wage in 1965, it would take them 1.7 years to afford a new Corvette.
For someone making minimum wage in 2024, it would take them 4.6 years to afford a new Corvette.
So with this comparison we can see just how bad the situation is in 2024.
Now lets compare the college tuition:
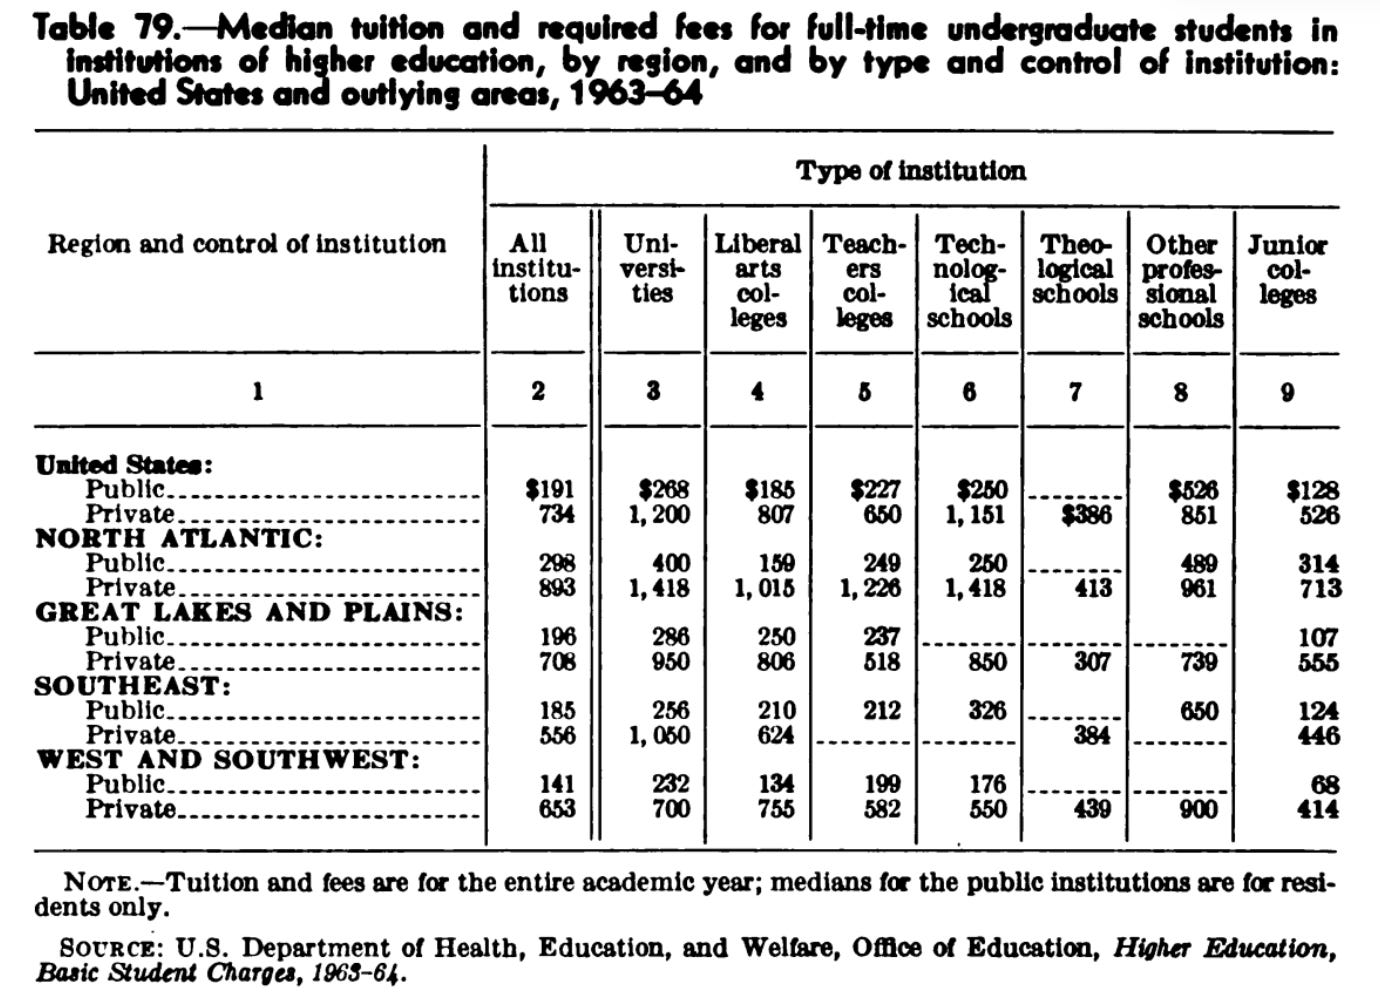
The average tuition cost in 1964 for all college institutions was $191 / year.
Minimum Wage:
1964 - $1.15 / hour
2024 - $7.25 / hour
Tuition Prices:
1965 - $191 / year
2024 - $15,000 / year
Since the conditions significantly improved after the Great Depression, it only took 1 month for someone working minimum wage to afford a whole year of tuition in 1964. Someone in 2024, in the same situation, would have to work a whole year just to afford tuition.
Now lets compare the housing prices:
The average home prices unfortunately kept increasing from the 1930’s to the 1960’s and ranged from $7000 - $20000. Someone making minimum wage in 1964 only needed 3 years of saving to afford a $7000 house, which is significantly better than the worst year of the Great Depression and especially today.

Adjust to inflation the minimum wage felt like $32 / hour in 1964 with an annual salary of $67,000, which should be the case today.
1995
Lets fast forward to 1995 and the 90’s because many economists say this decade was considered another boom decade like the 60’s.

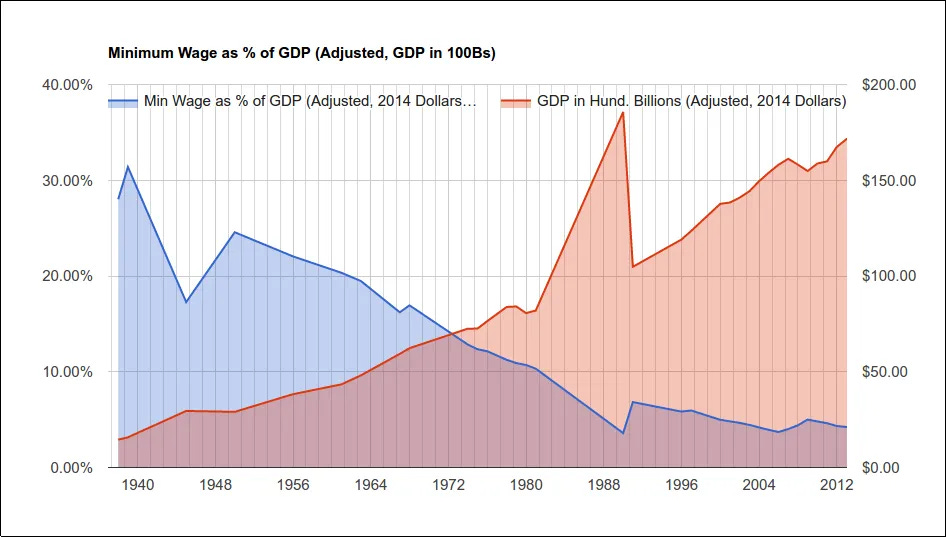
The minimum wage at this time was $4.75 / hour, which quadrupled in 30 years. This wasn’t due to the government looking out for its citizens. This was due to the Nixon Shock that took the Dollar off the gold standard and the American Dollar becoming a FIAT currency. Without a backed currency, inflation started to run rampant.
The quadrupling of the minimum wage may seem massive but it’s only until you compare it to the other major expenses that Americans have to pay for, the true reality is revealed.
For instance college tuition increased from $191 to $4338, a 22x difference from 1964.

In 1964, the average price of a new car was around $2000. In 1995, the average price shot up $17,000, which means it increased over 8x.

Lets go to housing. If you look at the housing chart from 1964, the median price of house in the 60’s and 90’s is showing. In 1964, the median price of a house was around $15,000 and in 1995, the median price was around $100,000, a 7x difference.
As you can see that 4x difference in the minimum wage from 1964 to 1995 actually hurt the citizens. The major expenses in an American citizens life were between 22x - 8x more expensive than in the 1960’s, while the minimum wage stayed at only 4x.
The government has failed its people.
The government knew these prices were raising significantly but purposely left the minimum wage behind.
The thing people need to understand is if the minimum wage is higher than ALL wages will be higher.
Greed is the bedrock of America and the people forgot to care about the lowest of the low. Unfortunately 1995 was just the beginning and it gets even worst the next 30 years.
The 1990’s is where we see a major turn towards greed from the government and companies but when adjust to inflation the minimum wage felt like making $20 / hour, when comparing it to today’s money. This is still significantly better than 2024 but way less than it’s supposed to be.
2024
In 2024, the minimum wage is $7.25, which is a 6x difference from 1964.
The average tuition now costs $15,000, which is a 80x difference from 1964.
The average new car price is $47,000, which is 24x difference from 1964.
The average price of a new house is $412,300, which is a 28x difference from 1964.
Below is an overview of how much money per hour the poorest Americans were making when adjust to inflation during the years we just went over. This was based of the wages and the housing prices of each time period compared with 2024:
1813 —> $416 / hour
1861 —> $139 / hour
1908 —> $104 / hour
1932 —> $7.69 / hour (Segregated African American worker during the worst year of the Great Depression)
1964 —> $32 / hour
1995 —> $20 / hour
2024 —> $7.25 / hour
The minimum wage needs be raised to $30 / hour or higher nationally in order for America to fix this problem. The minimum wage needs to be tied to median prices of the biggest American purchases: Housing, Automobile, Tuition, etc. in order to keep life fair for everyone.
Do you know see the fundamental problem in the United States? Remember if the government increases the minimum wage to where it should be it fixes all the problems we are seeing. It will force the increase of wages of all citizens to the correct amount.
The Great Depression forced a quintupling of the minimum wage but what we are seeing today is the opposite effect. There is no depression / recession. The Stock market is making new highs. The salaries of CEO’s have quintupled since 2020. The top 10 richest people in the world are worth over $200 Billion.
What we are seeing is the normalization of poverty. Live paycheck to paycheck is a normal thing. Never owning a house is becoming a normal thing. Taking out life-altering major loans is a normal thing.
Wonderful dig on the true purchasing power of the last 210 years. Not sure what the best solution is to fix this, but we can be sure that this entire plot was planned and you’ve summed up the results, ‘What we are seeing is the normalization of poverty. Live paycheck to paycheck is a normal thing. Never owning a house is becoming a normal thing. Taking out life-altering major loans is a normal thing.’
Then comes the ‘own nothing and be happy’ phase, the 15 minute cities, and total control of the enslaved population. Children ‘made’ in artificial wombs, and God’s wonderful creation is no more.
…That is until a plan was developed and many gifted key abilities by God…for this specific time and place.
God bless you, anon_fa_mous. 🙏🙏. Thank you for your part in the solution!
The system we live under is 100% based on greed. This is a great article showing how the common people are being squeezed out of a basic living. When you consider the jab genocide than we are living in the same conditions as ancient Hebrews in Egypt and ordered to make double bricks without straw. Living like this shouldn't be considered normal. The beast system can never create the conditions that man was meant to enjoy under Gods kingdom rule. The only good news is this is when the "Day of the Lord" happens.